Posted on Leave a comment

An Intro to Markets

What makes a market?

If there’s one thing that you can guarantee about the stock market, it’s that everyone has an opinion. At first blush, it seems fairly obvious that with so many different people participating in the market, there’s bound to be differences of opinion.

What many observers and inexperienced investors/traders don’t do, however, is to look deeper at what it is they’re actually saying by admitting that there are so many different opinions. By acknowledging the differences of opinion in the market, the most profound insight is that not everyone can be right at the same time. In other words, somebody has to be right and somebody has to be wrong. It is this very disagreement, in fact, that makes a market.

Two’s company but three’s a market?

So why is this seemingly trivial piece of information actually incredibly valuable? To understand why, we have to take a step back and understand first where a “market” comes from.

Simply put, a market arises because a buyer wants to buy something and a seller wants to sell something. Where they have to come to some agreement on is price. It is for that reason that markets are sometimes referred to as “price discovery mechanisms”.  One of the favourite questions Sparx encourages beginner traders to ask is: “how much is something worth?” Think about that for just a moment. The answer is “whatever someone is willing to pay for it”. Without both a buyer AND a seller, there is NO market.

Markets are born out of disagreement; they are built on one party believing one thing and another believing the exact opposite. For this reason, buyers and sellers compete directly with one another in what some call a “zero-sum” game meaning that the “winner” wins at the expense of the “loser”. While this is mostly true, there are also slews of “middle men” or brokers that facilitate buyers and sellers’ transactions (more on that in another article).

Posted on Leave a comment

A convenient way to think about trading

A convenient way of thinking about trading

Most people believe that in order to be successful in business, you have to be profitable, and for the most part they’d be right.  The primary “goal” is quite easy to measure – are you profitable or are you not? If you talk to any salesperson or sit through any company sales pitch, however, you may hear a different depiction of what businesses are. Namely they are “problem solvers”.

Whichever way you characterize it, businesses exist to supply products or services for those that demand (either want or need) particular products and services. It is helpful to point this out because if you decide you want to trade, it is much more practical to think of trading as one would if they were opening/operating their own business.   If you were to think of stock trading as a business you might start to ask:  what type of business am I? Who are my customers?  Who are my competitors?  Who are my collaborators? What kind of market is there for my product/service?  If you are trading a stock, though, what “problem” are you solving?

One very useful way to think about trading stocks is by way of an analogy with a convenience store.    The convenience store is in the business of having everyday items available in a convenient location.  Customers usually pay a bit of a premium for the “convenience” of not having to go out of their way to get the desired item. As a stock trader or investor, you are a convenient source of an item (stocks) that may be in demand. You solve the problem of inconvenient access to a stock for a buyer or seller.

Posted on Leave a comment

Money Talks Insider Conference

What: Money Talks Insider Conference

When: Nov. 19th 9am-4pm

Where: Sheraton Wall Centre Vancouver

How Much: $99+

The Money Talks Insider Conference is another in a series of regular events hosted by Michael Campbell, a well known figure in the Canadian investment world, most notably for hosting the radio show Money Talks.  This conference will feature some popular traders and analysts giving their opinions and perspectives on market conditions and investing ideas. To find out more information or to register online go to: http://www.moneytalks.net/moneytalks-insiders-conference.html

*Special Note via Stockscores: If you wish to buy tickets to attend the conference, use the promotion code SOBC2011 and receive $25 off plus $50 of your ticket price will be donated to the Special Olympics. Even if you can’t make it to Vancouver, it is possible to watch the conference on video, the information page has more details.

Posted on Leave a comment

World Money Show 2011

What: World Money Show 2011

When: Sept. 19-21st

Where: Vancouver Convention Centre

How Much: Free  (some presentations will require payment)

The World Money Show 2011 is coming to Vancouver Sept. 19th to 21st.  This is a huge event geared towards investors and traders alike with a slew of keynote speakers and presentations on everything from trading strategies to macroeconomic factors. Best of all, attendance is free! You can find out more about the show here: http://www.moneyshow.com/tradeshow/vancouver/world_moneyshow/main.asp?scode=013104 

Posted on Leave a comment

Events by Region

For traders and investors, there are many different resources out there that can provide information on everything from new products and services to trading strategies or trader education. Whether they be on the web or in person, connecting with experienced traders or investors is a fantastic way to not only build your trading knowledge base but also a chance to network.

If you are interested in webinar click the link below or select your region to find out about events in your area.

Webinars

Events by Region

  1. Alberta
  2. British Columbia
  3. Ontario
  4. Quebec
Posted on Leave a comment

Stocks 2011 Conference

What: Stocks 2011

When: Oct. 20-31st

Where: Hyatt Regency Vancouver

How Much: Free  (VIP section will require payment)

Stocks 2011 is an investment conference featuring some great speakers providing their insight into the stock market – from specific sectors and stocks to macroeconomic trends that affect the market. Although much smaller than the World Money Show, this event is a chance to get some thought provoking perspectives on the current markets.  In addition to presenters there will be companies showcasing products and services related to stocks as well as companies providing information on possible investment opportunities. To find out more information or to register online go to: http://www.stocks2011.ca/

Posted on Leave a comment

tradescores.com

Site: www.tradescores.com

Technical Analysis Tools: Yes

Fundamental Analysis Tools: Yes

Markets Covered: US, Canada

Notes: Tradescores is a great market analysis and training tool for beginners and intermediate traders. One of the greatest features of this site is the trading simulation tool which allows you to practice what it would be like to execute trades with a “practice” account. Unlike many other great simulators out there, what really makes this one stand out and worth using is the focus on risk management. Most simulators unfortunately only provide you with your percentage gained or loss in dollar terms – a real weakness in my opinion, because controlling risk is crucial to success in the stock market. Tradescores, on the other hand, forces you to use risk management techniques every time you place an order. By tracking your trades and showing you how much risk you are taking, this tool really helps traders zero in on developing this critical skill. The charting and interface are also fairly user friendly and so it earns high marks for a great set of features and user-friendliness. As an added bonus, there’s a community challenge that you can participate in to show off your trading skills with!

Posted on Leave a comment

StockCharts.com

Site: www.stockcharts.com

Technical Analysis Tools: Yes

Fundamental Analysis Tools: Yes

Markets Covered: US, Canada

Notes: A great site for technical analysis information, stockcharts.com has a comprehensive section called “ChartSchool” where you get as much technical info as you can handle. There are several great articles in this area that explain fundamental and technical analyses, as well as incredible sections on different chart types. The greatest feature about this site (and there are several) though has to be the extensive section on technical indicators and overlays. If you hear about different types of indicators like a MACD (moving average convergence divergence) or a moving average and you want to know what they mean, you’ll want to check out this section of their site.


Posted on Leave a comment

freestockcharts.com

Site: www.freestockcharts.com

Technical Analysis Tools: Yes

Fundamental Analysis Tools: Yes

Markets Covered: US, Canada

Notes: This is by far one of the most versatile free resources available to individuals looking for market information. The biggest strengths of Freestockcharts.com are that it provides near real-time data (basically as trades are happening), it has an incredibly easy to use charting program, a comprehensive set of technical indicators and best of all, it’s FREE!! There are paid options to use added functionality however there is still quite a bit that you can access for free. If you are looking to get started anywhere on a charting platform or are looking for trading data without a large delay, this is one you should seriously consider.

Posted on Leave a comment

Finviz.com

Finviz.com

Site: www.Finviz.com

Technical Analysis Tools: Yes

Fundamental Analysis Tools: Yes

Markets Covered: US

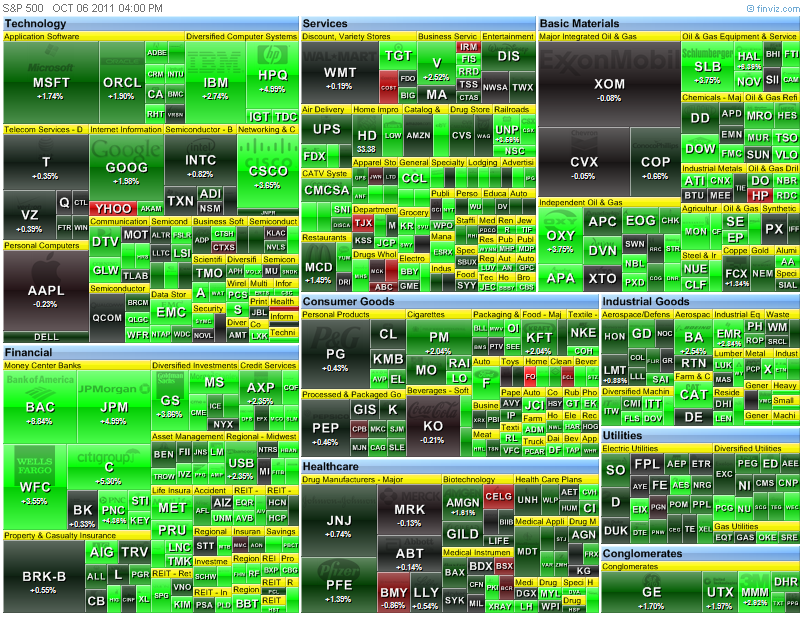
Notes: This is a fantastic site that provides market information throughout the day as well as some incredibly powerful yet easy to use filters to scan through the US stock markets. It is far and away one of my most favourite tools to use and best of all, many of the features are free. One of the best (and it’s hard to choose just one) things about this site is the visual element to the tools they provide. For example they have a “heat map” that visually shows you how each of the stocks in a particular market is trading. As you can see below (a picture of the heat map of the S&P 500), the stocks that have done well for the day are in green and those that have lost money are red (wouldn’t it be great if everyday was this green!!!) and those that haven’t really done anything are in black.

Heat Map of S&P 500
Heat Map of S&P 500 – wouldn’t it be nice if every day was this green?!