Finviz.com
Site: www.Finviz.com
Technical Analysis Tools: Yes
Fundamental Analysis Tools: Yes
Markets Covered: US
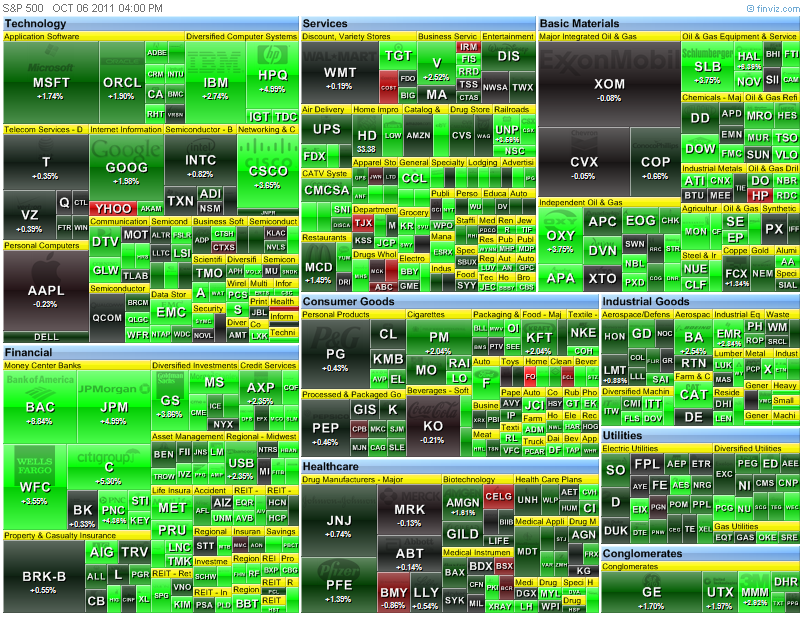
Notes: This is a fantastic site that provides market information throughout the day as well as some incredibly powerful yet easy to use filters to scan through the US stock markets. It is far and away one of my most favourite tools to use and best of all, many of the features are free. One of the best (and it’s hard to choose just one) things about this site is the visual element to the tools they provide. For example they have a “heat map” that visually shows you how each of the stocks in a particular market is trading. As you can see below (a picture of the heat map of the S&P 500), the stocks that have done well for the day are in green and those that have lost money are red (wouldn’t it be great if everyday was this green!!!) and those that haven’t really done anything are in black.

