Posted on

Discount Brokerage Weekly Roundup – May 31, 2021

It’s Memorial Day weekend in the US, which means that markets there are closed. Here in Canada, however, despite it being a short week last week, the volume of newsworthy developments was quite hefty. There’s lots to catch up on.

In this edition of the Roundup, we look at a big Canadian online brokerage making a splash by jumping into commission-free ETFs. From there, we continue to plumb the depths of more DIY investor data with an important online brokerage rankings release. As always, we cap things off with a snapshot of investor chatter from the DIY investing forums.

BMO InvestorLine Launches Commission-Free ETF Trading

Every now and then a tipping point development takes place in the Canadian online brokerage space. This past week, we might have just witnessed another important milestone in the price reduction for DIY investors.

News started to spread among DIY investors that BMO InvestorLine has launched commission-free ETF trading for a list of 80 ETFs.

This is clearly a big deal given the prominence of BMO InvestorLine in the Canadian online brokerage landscape. And, while they are not the biggest or most popular online brokerage, they do command a respectable amount of attention in online brokerage rankings, and they are part of the “Big Five” bank-owned online brokerages.

Commission-free ETFs at Canadian online brokerages are neither novel nor are they new to Big Five banks either.

Scotia iTRADE, for example, has a list of 49 (as of the date of publication). However, they launched this feature back in 2011 – almost ten years ago – and were followed by Qtrade (with a list of 100 commission-free ETFs) and Virtual Brokers in 2012.

National Bank Direct Brokerage also offers commission-free ETF buying and selling on all ETFs (Canadian and US) so long as minimum purchase amounts are met (minimum 100 units). And, for good measure, Questrade and Virtual Brokers offer commission-free buying of ETFs. Not to mention Wealthsimple Trade, where all Canadian ETFs can be traded commission-free.

Thus, BMO InvestorLine is not the first to jump into the pool by any means, but their offer is already making a splash among DIY investors, who are reacting with the same enthusiasm they did almost a decade ago when these free offerings first hit the market. The difference between now and ten years ago, however, is that commission pricing and consumer preferences and expectations have changed dramatically. Online brokerages in 2021 have to work a lot harder to impress investors today than they did in 2011.

What is interesting about the latest launch by BMO InvestorLine are the “strings” attached to trading these commission-free ETFs. While the list of eligible ETFs is respectable at 80, there is a restriction that investors must hold the ETF for at least one business day from the date of purchase, which is bound to create some friction with some active users. Upon deeper reflection, however, it seems like the math still works out in BMO’s favour.

By implementing the “speed bump” on the timing between purchase and selling, the day traders are going to be excluded (for now). This implies the feature is targeting “investors” (or swing traders), and will almost certainly challenge National Bank Direct Brokerage’s approach of the required minimum buy

Directly challenging Qtrade Direct Investing and Scotia iTRADE will come down to other features and conveniences that BMO InvestorLine can offer clients. As such, it seems like a faceoff between Scotia iTRADE and BMO InvestorLine – but in a great move at the puck drop, BMO InvestorLine has posted a public statement about wait times on its website. This is a direct shot at Scotia iTRADE, which has suffered extended wait times on its phone lines for years, reaching almost unimaginable durations during the past year.

BMO InvestorLine is a large enough competitor to the steady state operations of both TD Direct Investing and RBC Direct Investing, that this latest move to include commission-free ETFs will not go unnoticed. It will also not go unnoticed by the Wealthsimple Trade crowd who find the lack of additional features or slow money transfer annoying at times.

Interestingly, at the time of publication, we had yet to see a big, splashy announcement, but that is almost certainly forthcoming. What BMO InvestorLine’s latest foray likely signals, however, is that one of the standard features an online brokerage needs to come to the table with in 2021 and beyond is ultra-low cost ETF trading.

While wishing for industry-wide dominos to fall might have been premature in 2011, even with a prominent bank-owned online broker getting into the mix, the famous last words of “it’s this different this time” ring true.

Most of the Canadian online brokerage field has managed to do just fine up until now without having to concede ground on commission-free ETFs, let alone commission-free trading. That said, treading water when it comes to pricing or innovation in features no longer feels like an option when the investor tide has clearly turned towards lower-priced alternatives.

Latest Canadian Online Rankings Point to Underwhelming Experiences for DIY Investors

If April showers bring May flowers, it seems like those showers also have brought with them a deluge of data on the DIY investing space in Canada, the US, and even around the world.

The latest landmark data release to launch (publicly) occurred last week, when J.D. Power released the 2021 edition of their Self-Directed Investor Satisfaction Study for Canadian online brokerages.

Now in its 13th year, this study measures “investor satisfaction” among Canadian DIY investors who are clients at a number of popular online brokerages. This year, as in the past few years, eight of 14 or so Canadian online brokerages were included in the analysis, providing a reasonably good approximation of the state of investor satisfaction among Canadian investors.

Of course, regular readers of the Roundup know what’s about to come next when talking about another data report on DIY investors or online investing: we have to dive into the methodology to understand what is being measured and better contextualize the findings.

Like many other online brokerage rankings we’ve covered recently, this year’s J.D. Power investor satisfaction study contains a rich source of insight about DIY investors. And, while the reporting format is fairly standard to its historical structure, what caught our eye this year were the important changes that were made to how investor satisfaction was defined.

Methodology and definition changes aside, it was fascinating to unpack the data on this year’s win, but also to contextualize this year’s results against the historical data from this survey. This has helped to really clarify who has been working hard to consistently improve, who has struggled in 2020/2021, and what the DIY investor can expect when it comes to online brokerages in Canada (hint: it’s not great).

What are the rankings about – what do they measure?

Before diving into the results, it’s extra important to spend some time reviewing the methodology and what’s changed about what this study measured in its latest edition.

According to the press release announcing the findings, there were 2,011 Canadian investors surveyed from December 2020 to February 2021 about their perspectives on various components of the online investing experience.

As mentioned in previous coverage of this study, the definition of “investor satisfaction” is made up of multiple components, and this year the factors that comprise that definition changed. The table below shows the seven components that “investor satisfaction” was measured against in 2020 and in 2021.

Change in Definition of Investor Satisfaction: 2020 vs 2021
20202021
Firm interaction (1)Trust (1)
Account information (2)Digital channels (2)
Commissions and fees (3)Ability to manage wealth how & when I want (3)
Product and service offerings (4)Products and services (4)
Information resources (5)Value for fees (5)
Investment performance (6)People (6)
Problem resolution (7)Problem resolution (7)

While there are a couple of components, such as products and services and problem resolution, that appear in the same level of priority in both frameworks, the rest of the changes point to a significant difference in the drivers of investor satisfaction.

At the top of the list for 2021, “Trust” is now the most important driver, followed by “Digital channels” and the “Ability to manage wealth how & where I want.” In 2021, pricing – as measured in “Value for fees” – falls to fifth from third place.

One of the important limitations of the published rankings is that they did not provide detailed definitions of what these terms refer to specifically. And, with a term like “trust” there could be many different interpretations of what that refers to. Nonetheless, there are some reasonable assumptions that can be made around most of what these categories refer to. The most important point to take note of is that the construct of “investor satisfaction” – or even which online brokerage is “best” – is highly dependent on how that is being measured.

DIY investors place different weights on the importance of each of these factors, so although this survey provides a systematic approach to comparing investor attitudes and beliefs about the online brokerage experience, individual investors are likely to have differing opinions on how well or poorly these results match their own experiences.

What are the findings from this year’s results?

With some important qualifiers out of the way, the results from this year’s study paint a portrait of an industry that has struggled to keep pace with the level of demand from DIY investors. Whether it was on the customer service front, where wait times and getting through to a human was nearly Sisyphean, or it was on platform stability on the most volatile of trading days (or some not-so-volatile days either), how online brokerages weathered the storm became evident through the data gathered in this study.  

Perhaps the most telling finding in this regard is that 24% of investors reported having at least one problem with their firm in the past 12 months, up from 14% in 2020 and more than double the rate in the US (11%). For active investors, this is a big problem when it comes to assessments around reliability. For less active investors, however, if the most “exciting” days to be in the market are fraught with outages, delays, or interruptions to service, there is almost no second chance to make a first impression.

And, according to additional findings in the data, those hiccups matter. 20% of investors who experienced a problem stated they are considering switching, which is more than three times the rate of those without issues who would consider switching online brokerages.

According to Michael Foy, Senior Director and Head of Wealth Intelligence at J.D. Power:

“Especially for newer clients, those who have not yet developed strong loyalty with these firms, who are more likely to leave if they have a bad experience. Investors today have more choices and firms need to raise the bar on the experience they deliver.”

Of course, beyond the contextual information, the focal point of the rankings is the list of how each online brokerage scored.  

National Bank Direct Brokerage654
Questrade645
RBC Direct Investing615
BMO InvestorLine607
Desjardins Online Brokerage599
TD Direct Investing591
CIBC Investor’s Edge585
Scotia iTRADE576

The table above shows the numerical scores achieved by Canadian online brokerages that were reported on for this study. The scoring for the online brokerage ranking by J.D. Power is out of 1,000, so it was interesting to note that this year the scores were lower on average than they have been historically (more on that in a moment).

The average score across the eight online brokerages that were reported on was 602. On an absolute basis, it is tricky to compare year over year results now that the evaluation criteria has dramatically shifted. However, on a relative basis, it is possible to derive additional insight.

One of the first things that is important to point out is the spread between first and last place. In this case, the distance between the top and bottom of the ranking is 78 points. By comparison, last year’s ranking saw a difference of only 33 points between top and bottom. It is therefore fair to say that volatility in this year’s rankings reflect some meaningful differences in the way online brokerage operations are impacting investor satisfaction.

The difference between first place ranked National Bank Direct Brokerage and second place Questrade was only nine points, but the difference between second and third place (RBC Direct Investing) was a whopping 30 points. What this implies is the top two firms substantially outperformed the remainder of their peers on the measures contained in this ranking.

Curiously, the difference between placements from third place onwards is a fairly consistent six to nine point drop. This linear decrease is probably an artifact of certain kinds of measures, but it implies that the bottom six online brokers could make significant strides on this index with a minimal amount of effort invested in customer satisfaction.

What is not a coincidence, however, is that five of the bottom six online brokerages in this ranking are the Big Five bank-owned Canadian online brokerages. The differentiating factors between these brokerages are minimal, so it stands to reason that investor satisfaction levels with these bank-owned online brokerages is probably pretty close too.

In contrast, the data from the latest online brokerage survey imply that the firms at the top have found the right mix of service and pricing with DIY investors in 2020, which has created a big gap between these firms and the rest.

National Bank Direct Brokerage and Questrade were able to do something very different and appealing for their clients, compared to the rest of the industry in 2020.

How do this year’s results stack up over time?

It’s at this point that historical data is incredibly helpful to provide additional context around online brokerage performance on the J.D. Power Investor Satisfaction rankings.

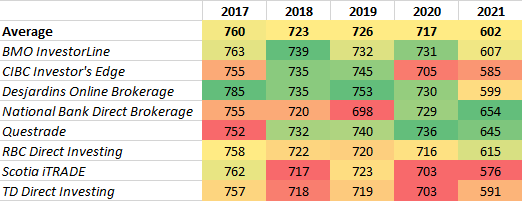
Analyzing the results from 2017 to 2021, one of the first things that immediately jumps out is that the average investor satisfaction scores with Canadian online brokerages, regardless of how they’re measured, have been decreasing.

Scores from J.D. Power Canadian Self-Directed Investor Study 2017 to 2021 (heatmaps applied to each year).

The stretch from 2020 to 2021 is an anomalous one in terms of customer composition for online brokerages because so many new investors have joined the client pool.

As the J.D. Power study pointed out, many of these new clients haven’t had the benefit of seeing what the experience was prior to this year. With the number of service and performance issues many online brokerages suffered from, the risk of new clients who joined an online brokerage leaving shortly after joining is likely higher than it’s been in the past.  

For DIY investors who have been around since 2016 (which is what the 2017 data would have captured) or earlier, J.D. Power’s satisfaction scores imply being a DIY investor has probably felt like an investment with diminishing returns at most of the brokerages analyzed. Even if pricing has become more competitive, the value proposition has not improved overall, at least in the firms whose data was published as part of this ranking.

Since not all online brokerages were reported on, it is hard to say what the DIY investor experience has been like at Qtrade Direct Investing or Interactive Brokers or even Wealthsimple Trade, names that are often associated with significant enthusiasm in either rankings or DIY investor community discussions.

Another remarkably consistent pattern that stands out with these rankings is not so much who’s at the top, but rather who has remained at or near the bottom.

In three of the past four years, Scotia iTRADE has ranked as the online brokerage with the least satisfied clients, with TD Direct Investing not too far behind. Historical data also shows that CIBC Investor’s Edge has gone from being among the top online brokerages as recently as 2019 to second last in 2021.

Looking back over the past five years, Questrade stands out as an online brokerage that has continuously strengthened its satisfaction scores, and although it dropped from top spot last year to second place this year, it continues to move in a positive direction for DIY investors, even under the new evaluation criteria. On a relative basis, RBC Direct Investing has gone from a consistently average score to one that is better than average.

Historical investor satisfaction data also helps to quickly spot online brokerages who had an especially rough year in terms of maintaining investor satisfaction.

Desjardins Online Brokerage, for example, went from a market leading (or high scoring) position from 2017 through 2020 to being below average in 2021. Another unusual score was BMO InvestorLine’s. Like Desjardins, BMO InvestorLine consistently placed at or near the top from 2017 through 2020, however for the 2021 results, BMO InvestorLine just barely beat the average.

As mentioned above, the changes in the methodology used to define investor satisfaction make comparing absolute scores from one year to the next hard to do, but the relative position of each of these Canadian online brokerages to one another makes it clear who the leaders and laggards are. Perhaps most compelling is that the bottom of the pool did not really change in 2020 and 2021 despite the shift in how things are being measured.

Takeaways

There are a number of very interesting takeaways from the latest online brokerage rankings by J.D. Power.

As other data points have indicated, most Canadian online brokerages were not ready for the crush of new business in the form of DIY investors wanting to sign up for new accounts, or for the flood of investor trading volume that came with it. What the J.D. Power satisfaction study helped put into sharper focus was the impact to firms via the voice of their customers.

The new methodology by the investor satisfaction study puts Trust at the top of the criteria that they now evaluate online brokerages with. In a world where pricing among online brokerages is increasingly under pressure, DIY investors are still going to expect that an online brokerage platform be reliable, and when pricing is high, so too are expectations around the ability to perform when needed.

National Bank Direct Brokerage appears to have figured out some key ingredients. Low commissions, and entirely free commission buying and selling are important on the pricing front, and whatever they happen to be doing on the service front is working as well.

The latest evaluation by Surviscor highlights the pricing advantage that National Bank Direct Brokerage offers relative to other brokerages, and National Bank Direct Brokerage is starting to gain traction in discussions on social media channels. With this additional accolade, the “trust” profile and the interest in National Bank Direct Brokerage is sure to grow.

According to the J.D. Power Investor Satisfaction Study, Canadian online investing satisfaction scores are nothing to write home about. The troubling trend the historical data has uncovered is that there is a palpable gap in innovation and enthusiasm to do better for clients. Compared to the US, most Canadian online brokerages are trailing in areas that are critical to building loyalty and client delight.

The opportunity to any Canadian online brokerage who reviews this data is that an extraordinary service or innovative experience can earn and win a lot of praise. As the saying goes, there is far less traffic on the extra mile, so firms doing more in either service or innovation are going to stand out (in a good way).

From the Forums

Riding the Commission-Free Waive

It’s hard to keep a deal this good a secret for long. Eagle-eyed DIY investors spotted a new commission-free ETF feature at BMO InvestorLine before any official announcement. Here are a few links of interest worth browsing:

BMO InvestorLine Now Offering Commission Free ETFs (reddit)

Zero Commission ETFs (Financial Wisdom Forum)

Commission Free ETFs at BMO Investorline (Red Flag Deals)

Commission-Free at Last

Is the grass (and account statement) really greener on the other side of the $10 commission per trade? One forum user sparked a lively discussion of DIY investors on the topic of switching away from paying higher fees for trading online. Read more about what users had to say here.

Into the Close

With US markets closed, there’s only one story that matters to many Canadian DIY investors – will the Leafs beat themselves? Ironically the last time the Toronto Maple Leafs were in the Stanley Cup playoffs was the same year Friends signed off, which was 2004. In 2021, it’s going to be debatable who had the bigger comeback.

Posted on

Discount Brokerage Weekly Roundup – May 24, 2021

Stock markets in Canada were closed for Victoria Day, but that did little to dampen activity and enthusiasm for DIY investors looking stateside (or further afield) for trading opportunities. And they’re not alone. On the unofficial start to summer, we decided to peek across the (still-closed) border with the US to catch up on important trends and developments in the US online investing space.  

In this America-focused Weekly Roundup, we look at interesting developments among the biggest and smallest online brokerages in the US, and how each is shaping what DIY investors can expect from their online investing experience. First, we focus on the biggest player in the space, Schwab, and what some recent data released by them suggests about DIY investing enthusiasm. Next, we turn the spotlight onto another online investing player, tastytrade, who has demonstrated just how far enthusiasm and community can take an online trading brand. As always, we cap things off with some interesting DIY investor conversation to ease back into the shortened week (here in Canada).

Scaling New Heights: Lessons from Schwab After Peak YOLO

When it comes to online brokerages, there’s big, there’s bigger, then there’s Charles Schwab. Given its gargantuan size and diverse business activities, it’s almost a misnomer to characterize one of the original discount brokerages as such in 2021.

With banking activities, managed wealth, and a host of other financial services that go beyond online stock trading, online trading makes up a small fraction of where Schwab makes their money these days. Even so, given the number of accounts and reputation in the US online brokerage market, Schwab is undoubtedly an influential force with retail investors.

Just how big is Schwab?

Their recently reported trading metrics from April listed  total client assets as $7.34 trillion (USD), an increase of 4% from March and 94% from April 2020 (not a typo). At these levels, spreadsheet columns have to be widened to accommodate the number of digits in a cell to properly total things up. So, if there’s one measure to indicate that you’ve made it in the world, it might just be that.

One of the reasons that they continue to grow at such an extraordinary clip was also reported in Schwab’s latest performance report.

In April, Schwab opened 609,000 new online brokerage accounts (also not a typo), which is over three times what they opened in the same period last year (201,000 new accounts). By comparison, Interactive Brokers, another popular publicly traded US online brokerage, opened about 34,200 net new accounts in April – not an apples-to-apples comparison, but it does provide a reasonable approximation of the scale of difference between the two online brokerages.

While the snapshot of data is mind blowing on its own, when put into context across time, the account opening data at online brokerages like Schwab and Interactive Brokers reveal a possible trend forming: a peak in the surge of DIY investor interest.

Of specific importance is comparing the drops in new account openings at Schwab and Interactive Brokers as an indicator that the “fast money” active traders have stepped away from the online trading space in larger numbers than less active investors have. Thus, Interactive Brokers and firms that cater to active traders will have seen a stronger pullback than firms that cater to “average” DIY investors.

Consider the following: compared to March, the number of new accounts opened at Schwab in April was actually down 28%. By comparison, Interactive Brokers saw a drop of 43% in net new accounts on a month-over-month basis. At both brokerages, new account openings have declined double digits for the past two months, and in the case of Interactive Brokers, the declines in new account openings started in February.

What this data signals is that US online brokerages are seeing elevated account openings relative to last year but a rapidly declining rate of new account openings from retail investors in 2021. In short: the flood of DIY investors appears to have crested.

Due to COVID-19, 2020 and 2021 have been strange years to say the least. Even though a lot has already been written about the elevated interest in investing online, industry analysts have understood that a drop off was bound to occur at some point. The profile of that drop off, however, is starting to become more clear and that has implications for online brokerages during the transition back to a more normal economy.

With May just around the corner, the volume of new accounts will be an important indicator to watch to see if the contraction in account growth is accelerating or decelerating.

Regardless of the direction of new account sign ups, the data on total accounts opened at online brokerages reveals an unmistakable feature: there are lots of new investors who decided to open up online investing and trading accounts in 2021 – a fact that is all the more impressive considering the surge in interest in online investing by investors last year at about the same time.

The question confronting online brokerages such as Schwab and Interactive Brokers is: will these new investors will stick around?

Some important clues to answering that question came from the spring business update presented by Schwab in late April this year.

One important data point (hooray, more data) is that 70% of clients new to Schwab’s retail trading business in the first quarter of 2021 were under the age of 40. Demographically, this sets the stage for long-term retention if the client experience and value proposition are in place to properly cater to this group of investors.

The strongest statement regarding the outcome of the increased interest by newer investors is seen in the slide shown above. Schwab expects retaining clients, and their assets, even if trading activity levels decrease as markets stabilize.

It is this forecast that spells out one the most important strengths of having the kind of scale that Schwab does. With that kind of size, even small percentage improvements in revenue generating activities can tremendously impact the bottom line.

For example, two trends on the above slide show that retail trades per account have more than tripled from December 2019 to March 2021, and that margin balances as a percentage of total client assets have also increased from 0.7% in Q4 2019 to 1.0% in Q1 2021.

A recent promotional email received from Interactive Brokers helps to illustrate why margin loans trending up at Schwab is so important: the margin loan rates at Schwab are substantially higher than at Interactive Brokers.

Thus, the interesting (no pun intended) picture emerging is that for the new investors who joined Schwab and who are going to be more actively trading, an almost 5x cost differential in margin lending rates is going to matter at some point. In case you’re curious, the margin lending rate at Robinhood is 2.5% at the time of publication, which underscores just how fiercely competitive Interactive Brokers is when it comes to features that typically appeal to active traders.

The challenge for Schwab, and really any online brokerage that wants to generate revenues in a zero-commission model, is to charge more for other features, like margin interest, to offset the forgone revenue from trading commission.

For Canadian online brokerages, margin interest rates are a feature that appeal to active investors or investors with larger assets who don’t trade as frequently but who use margin. Both these segments represent high value clients to an online brokerage, so rather than dropping commission rates to zero, savvy online brokerages in Canada may provide attractive margin rates in order to win new clients (or retain existing ones).

The US online brokerage market is fiercely competitive in many respects, however, because they have largely moved to a “zero-commission” world there are other aspects of their business, such as margin rates, that mainstream online brokerages have been slower to compete on. Here in Canada, where zero-dollar commission trading is not really prevalent, margin rates seem like an interesting area to watch.

As was mentioned last week in our coverage of Surviscor’s analysis of pricing among Canadian online brokerages, there is no such thing as a “free lunch,” and as a result, DIY investors can expect to pay the price for commission-free trades in other parts of the online trading experience.

The key takeaway from the latest set of data indicators at Schwab are that there is now a large cohort of online investors who have opened up online investing accounts, who will likely be in need of a very different kind of investing experience going forward than what spurred them to be interested to begin with. If the “fast money” has exited, and markets have less volatility, active traders are going to be hard pressed to find compelling trading opportunities – which is a need almost all brokerages will have an interest in trying to address regardless of size.

The Power of Small: Tastytrade Built a Billion-Dollar Business on Community

This past week, the online financial media powerhouse tastytrade celebrated an impressive milestone: their 10 year anniversary. As part of that accomplishment, they released a very interesting documentary that profiled how the tastytrade brand was conceived, launched, and has grown over the past decade.

The documentary is fascinating content on a number of levels. From the background of how the company came to be named after a popular Philadelphia-area snack, to the palpable enthusiasm for doing something different in finance, the video captures the journey of the tastytrade brand through their first 10 years and ends with an intriguing view of trading in the future.

What is most compelling about this documentary, however, is that it showcases how a powerhouse online investing brand can develop by focusing first on delivering engaging, people-centred content.

It helps to understand that one of the founders behind tastytrade is Tom Sosnoff, the founder of the ultra-popular options trading platform Thinkorswim. Thinkorswim was eventually acquired by Ameritrade (which was then acquired by TD, and the resulting entity, TD Ameritrade, was eventually acquired by Schwab). Thus, the roots of tastytrade’s success in talking in-depth about trading options trace back to Sosnoff’s pioneering work with the Thinkorswim platform.

In the documentary, Sosnoff’s journey from Thinkorswim to tastystrade helps to explain a lot about how the core team that started tastytrade came together, and more importantly, the fact that the focus behind tastytrade was to build financial content in a way that was as much entertaining as it was useful.

Really interesting financial content, it seems, is in very limited supply. And as a result, the business model for tastytrade appeared to be to create an audience of individuals who are interested in and educated about options trading, and that would ultimately set the stage for the online brokerage arm, tastyworks, to translate that viewership into clientele.

As with many great entrepreneurial endeavours, the founders of tastytrade didn’t envision exactly where the business would get to. The billion-dollar acquisition of tastytrade in January of this year, however, validated the premise that building an engaging platform to help investors navigate the world of investing – including something as complex as options trading – would be of real value.

Another very interesting facet of the documentary is the way in which the tastytrade “secret sauce” came together.  

Perhaps it was the comfort level with risk that naturally accompanies a lifelong trader, but the idea to staff a financial content company with comedians to deliver financial information is anything but traditional. In fact, what is genuinely interesting to witness over the journey of the past ten years, is the constant level of experimentation with different types of shows and formats that inevitably has led tastytrade to where it is today – being able to generate live programming seven days a week, having over 100 shows, and a growing global audience (the stat shared about audience cited over 100 million hours of views) reaching 190 countries.

Ultimately, the winning set of ingredients for programming on tastytrade came down to having an authentic interaction between traders and the not-yet-trader staff captured in real time.

Having Sosnoff and co-host walk the talk about their trade ideas and strategies, engage in random banter, and do so in a down-to-earth fashion tapped into the DIY investor culture in a way that traditional news media or traditional approaches to financial content never quite got right. Before podcasting exploded, Sosnoff sought a radio-show feel to the tastytrade core programming, and as a result of a lot of trial and error, the end result was understanding how best to deliver the message through various media.

Although shows are planned and professionally produced, they don’t feel overly scripted. There is visible diversity and a tangible enthusiasm for either learning about trading, or teaching trading, or just talking about trading (or the things that traders would inevitably talk about in the news). In short, Sosnoff and the tastytrade team nailed the culture of trading, because many of those planning or participating in shows have been a part of that world for so long.

This is not unlike the approach of Thomas Peterffy during his tenure as CEO of Interactive Brokers. Like Peterffy, Sosnoff understands the mindset of traders, and to his credit surrounded himself with a team that has created a very loyal and vocal community of traders/viewers (aka tastynation).

For online brokerages in Canada – and likely the world over at this point – there is an inescapable reality about the business: order execution is not enough. What tastytrade and tastyworks clearly demonstrate is that self-directed investors need both education in the form of navigating strategies and principles related to investing, as well as trading ideas. And, as any patient spouse or family member of an avid DIY investor will attest to, self-directed investors also need what other humans need, connection and community. And, tastytrade offers the latter in large measure.

Instead of analyst reports and the traditional news feed of financial data, tastytrade has shown that taking a human-centred approach makes financial content more accessible. And they’re not alone. Robinhood understood this with their purchase of the podcast Market Snacks (now Robinhood Snacks), a financial content show that provides updates on popular market stories and publicly traded companies. Regular (i.e. daily) content with personality that audiences can develop relationships with build and drive loyalty. It compels people to tune in, and in turn, feel more comfortable and even confident in taking on trading ideas they hear being discussed.

Despite the regulatory hurdles in Canada that constrain how much in-house content can be created at an online brokerage, tastytrade and other online brokerages in the US have shown that the formula for success and client delight is enhanced with compelling and delightful content.

As of right now, there is no clear DIY investor content leader among Canadian online brokerages. However, sometime in the not-too-distant future that may change. Tastytrade and tastyworks have publicly telegraphed their intent to come to Canada, and when they do, it will be a challenge for any online broker here to compete against that human-centred content machine.

It’s already clear that certain online brokerages are trying to generate “investing” content. Simply creating content and having it available on different channels, however, is a brute-force way to get attention on content. While it might “work” in the short term, it is highly transactional and not at all a part of what human investors ultimately seek – which is community and connection.

Although coming to Canada is not mentioned directly in the documentary, where tastytrade plans to go next is equally fascinating.

Now part of a much larger global brand, if tastytrade can retain and direct much of what has contributed to their success to date, the technologically immersive experience of online investing previewed in the video reiterates just how much trading culture and community is at the heart of the growth strategy. Ironically, or perhaps expertly, tastytrade has demonstrated the ability to grow exponentially bigger by focusing on creating the feeling of being small.

From the Forums

Gearing Up for Leverage

Making decisions to trade using margin or leverage is not something to be taken lightly. Looking to the wisdom of crowds, one young investor taps into the online investing opinions of reddit for perspective on whether or not leverage is worth doing with a secured line of credit. Read what redditors had to say here.

Minding Your Own Business

Trading online as an individual is one thing, but getting a corporate account to trade online with can be surprisingly personal. One online investor turned to other investors for guidance on whether the assurances sought by one online brokerage for a corporate trading account were, in fact, appropriate. Find out more here.

Into the Close

That’s a wrap on the long-weekend edition of the Roundup. With so much of the focus of this Roundup on the US, there is another important and sombre milestone in the US taking place this week: the one year anniversary of the murder of George Floyd. There has been a lot of heavy-hearted news over the past year, however, one thing that is clear is that we can all play a part in eradicating racial injustice and discrimination. If you’ve found your way to this part of the Roundup, take a few moments to reflect on or read about racial injustice. There’s also a simple but powerful film on the topic below.

Posted on

Discount Brokerage Weekly Roundup – May 17, 2021

With the weather starting to warm up, flowers aren’t the only thing springing up at every turn. This month, it seems like DIY investing data continues to bloom, offering some very colourful perspectives on the current online trading landscape.

In this edition of the Roundup, we dig into yet another treasure trove of online brokerage and DIY investor data and find out why measuring the similarities between online brokers is challenging. Also, we’ve got reactions by DIY investors to interesting survey results and more in the forum chatter.

Reviewing Online Brokerage Pricing: Latest Rankings Challenge Perceptions of Low-Cost Online Trading

Another week, another big online investing data report to talk about.

This past week, fees at Canadian online brokerages were under the microscope, as Canadian financial services research firm Surviscor published a significant analysis of the fee structures at 15 Canadian online brokers and found some surprising – and at times controversial – results.

If there’s been any recurring theme to the coverage of the reports we’ve analyzed over the past few weeks, it’s that context matters. In particular, while it is tempting to focus on the headline results, it is often crucial to understand the methodology underpinning a study to properly understand the outcomes.

In the case of this latest analysis by Surviscor, this is especially true, because question at the heart of this study is “Who is Canada’s lowest cost online brokerage?” As any long-time reader of the Weekly Roundup will know, however, the answer is usually “it depends.”

So, before diving into the results, we’ll start by looking at the methodology and process information provided about this study which will better enable readers to understand how the results were ultimately arrived at.

Method Matters

One of the most interesting features of the Surviscor online brokerage fee analysis is sheer number of different factors that it considers. Like anything, however, the devil is in the details.

At a high level, the following six cost categories were measured:

  1. Equity trades
  2. Options trading commissions
  3. ETF commissions
  4. Data costs
  5. Account interest rates
  6. General account fees
Stock commissions

When it comes to equity trades, over 12,600 simulated equity orders were analyzed. Specifically, 6,300 buy and sell orders for Canadian and US equities, respectively, were measured. The prices and volumes of securities varied and ECN fees were applied where applicable.

Options commissions

Treated as a sub-category, options commissions on a total of 340 option orders, split into 170 Canadian and US buy and sell orders (of various price and contract levels), were measured.

ETF commissions

Over 350 ETF orders consisting of over 175 Canadian and US buy and sell orders were analyzed, each order consisting of 700 shares per order.

Data costs

Market data fees were examined in this category, and consist of the fees charged by firms to provide real-time quotes, streaming quotes, trading dashboards, and “enhanced” research and tools.

Account interest

This category measured debit and credit interest for both non-registered and registered accounts in Canadian and US accounts.

General account fees

Fees included and measured in this category refer to inactivity fees, non-registered and registered account annual fees, charges to transfer assets, confirmation fees, closure fees, and account investigation fees.

Another important methodological point to understand is that profiles of traders/investors were broken into the following five categories based on the number of trades made per month:

  1. 0-4 trades
  2. 5-9 trades
  3. 10-33 trades
  4. 34-49 trades
  5. 50+ trades

Results & Analysis

The table below shows the rankings of all the Canadian online brokerages measured as part of this study.

RankOnline BrokerageScore
1National Bank Direct Brokerage93%
2*Wealthsimple Trade86%
3Desjardins Online Brokerage83%
4HSBC InvestDirect77%
5CIBC Investor’s Edge76%
6Qtrade Investor (now Qtrade Direct Investing)61%
T-7RBC Direct Investing54%
T-7Scotia iTRADE54%
T-7Laurentian Bank Discount Brokerage54%
T-10TD Direct Investing53%
T-10BMO InvestorLine53%
12Virtual Brokers50%
13Questrade45%
14Canaccord Genuity Direct42%
15Interactive Brokers22%

The online brokerage that took the top spot in this edition of the online broker cost ranking was as much of a surprise as two of the bottom three rankings.

Starting from the top of the podium, National Bank Direct Brokerage came out on top in this study with the highest score of 93%.

Although it was not entirely clear based on the methodology what the percentage refers to exactly, on a relative basis it is clear that this bank-owned online brokerage managed to outrank its competitors because of lower standard commission pricing (which impacts equities and commissions trading), as well as the fact that it offers commission-free ETF buying and selling when at least 100 ETF units are either bought or sold.

Taking second place with 86% was a name that many newer investors and much of the popular press on online investing has characterized as the lowest cost online brokerage: Wealthsimple Trade. There was a heavily telegraphed caveat to the results of this study (the elephant-sized asterisk) when it came to Wealthsimple Trade, which, for several reasons to be covered below, makes them a very controversial pick for second place overall in this ranking.

In third place was Desjardins Online Brokerage – the direct rival to National Bank Direct Brokerage – who scored 83%. Desjardins Online Brokerage was the winner of this ranking last year, and depending on whether or not to include Wealthsimple Trade’s limitations, this online broker might have ended up in second place overall.

Aside from Wealthsimple Trade, what is noteworthy about two of the top three online brokerages in the fees ranking is that they are both heavily focused on the Quebec market. Not that many Canadian online investors outside of that province are likely to know about these two providers.

The fact that both of these brands compete aggressively with one another means that there is pricing available for active traders at each of these firms that is unheard of at other online brokerages across Canada. Desjardins Online Brokerage, for example, charges $0.75 per trade if more than 30 trades per month are made. By comparison, National Bank Direct Brokerage charges $0.95 per trade for clients who make 100 trades per quarter.

Looking at the top five ranked firms in this latest study, it shows that having a low standard commission price significantly improves the ranking position. Again, excluding Wealthsimple Trade, four of the top five online brokerages in this latest ranking have a standard commission rate that ranges from $6.88 to $6.95 per trade. Also worth noting is that the only big-five bank-owned online brokerage to appear in the top five is CIBC Investor’s Edge, however, both National Bank Direct Brokerage and HSBC InvestDirect (which placed fourth overall) are bank-owned online brokerages.

Thus, one of the biggest findings that this study helps put into focus is that value-conscious online investors can find competitive pricing and convenience with banking products, all in one online brokerage.

Another interesting set of results emerged with the three online brokerages tied for seventh place and two that tied for tenth. The scores for online brokerages that ranked seventh were 54%, while the scores for tenth place were 53% – a razor thin margin. While it seems strange to be focusing on this middle-of-the-pack group, four of Canada’s biggest five banks have an online brokerage that appeared in either seventh or tenth place when it came to fees. Perhaps the most shocking or surprising finding is that relative unknown Laurentian Bank Discount Brokerage was tied with RBC Direct Investing and Scotia iTRADE, and it managed to do better from a cost perspective than TD Direct Investing and BMO InvestorLine.

That so many of the biggest bank-owned online brokerages in Canada performed so closely to one another is a signal that when it comes to fees, these brokerages are virtually indistinguishable. This result likely reinforces the perception that there is no real difference when it comes to commission or trading price for big-bank-owned online brokerages. The differentiators will come in features or service elements.

While the bottom ranked online brokerages typically don’t get much attention in online brokerage reviews, this time seems different. Specifically, three big names often associated with low cost of trading online managed to make up three of the bottom four spots. Virtual Brokers, Questrade and Interactive Brokers, ranked 12, 13 and 15, respectively.

One feature that each of these three online brokerages have in common when it comes to pricing is that they have a variable component to how they charge for trading stocks. Virtual Brokers and Questrade, for example, charge $0.01 per share with a minimum trade cost and maximum trade cost. Similarly, Interactive Brokers charges $0.01 per share with the maximum charge being 0.5% of the trade value.  

Arguably, aside from the variable pricing, there are also ECN fees which factor into the total commission cost for trading with Virtual Brokers, Questrade, and Interactive Brokers. So depending on the type of order placed (e.g. limit order versus market order), the cost of executing a trade can be far higher than just the commission price.

Method Determines Measures

Why it was so important to start this exploration of the Surviscor report by highlighting the methodology is because the way in which certain components were measured influenced the overall ranking outcome.

One example that stands out is with respect to ETFs. Recall that according to the ETF component of the cost evaluation, 700 “shares,” or units, was used as the standard buy or sell amount. It is difficult to say what the “average” or even the weighted average number of ETF units would be during a typical transaction. However, for many investors, that could represent a significant dollar purchase.

Consider, for example, the cost for purchasing 700 units of one of the most popular ETFs among Canadian online investors – VBAL. The last price for this ETF was $29.15 so an order to buy 700 units would cost $20,405 before commissions.

This transaction would be commission-free at National Bank Direct Brokerage, Wealthsimple Trade, Questrade, and Virtual Brokers. If, however, the number of units purchased was lower, say 50 units, then the commissions for the transaction (buy and sell) would see Wealthsimple Trade come out on top with zero commissions, followed by Virtual Brokers and Questrade, while the transaction at National Bank Direct Brokerage would cost $13.90 ($6.95 for each of the buy and the sell).

That picture changes dramatically, however, if the transaction was for a US-listed ETF. For an ETF like VTI, which had a closing price (at the time of publication) of $215.54 US, 700 units before commission would cost $150,878 US. The commission prices for National Bank Direct Brokerage, Questrade. and Virtual Brokers would be zero. However, at Wealthsimple Trade the foreign exchange fee would be 1.5% times the corporate foreign exchange rate (which at the time of publication was $1.21070). In this example, that means the rate of $1.2289 would apply, which means that instead of costing $182,668 CAD, the forex conversion cost would work out to $185,408 CAD, and would mean a difference in cost of $2,740.

It is for that dramatic difference in potential cost to consumers that, as part of this cost analysis, Wealthsimple Trade comes with a very substantial asterisk. Certainly, there are some situations, such as trading Canadian securities, where Wealthsimple Trade could come out ahead in terms of cost relative to other Canadian discount brokerages. However, any substantial transactions taking place for US-listed securities would be significantly more expensive.

Given that Wealthsimple Trade also has restrictions on the securities and markets that DIY investors can trade on, whereas many other online brokerages do not, it becomes harder to rank Wealthsimple Trade on an apples-to-apples basis.

It is unclear how Wealthsimple Trade was graded for the US-listed securities that would have been traded (700 shares/units of US ETFs and which US stocks) as part of the testing framework, as well as how Wealthsimple Trade was graded for options trading and margin lending (which are not currently offered by Wealthsimple Trade).

Without knowing which securities were used in the test and which order types, it is harder to pinpoint why Wealthsimple Trade ranked as highly as it did, despite limitations for currency conversion and trading certain securities that other online brokerages would have no issues with. Similarly, this could potentially have an impact on other online brokerages such as Questrade or Virtual Brokers, where buying ETFs is commission-free, or for Qtrade Direct Investing and Scotia iTRADE, where there are certain ETFs which are completely commission-free to trade.

Takeaway

With so much data being analyzed, it is no small feat to be able to organize and score all of Canada’s online brokerages even on something as quantifiable as cost.

Surviscor’s latest evaluation of online brokerage costs reveal the challenge of trying to deconstruct a lot of intentional differentiation effort on the part of Canadian online brokerages. If it is not easy for the professionals to do it, it is certainly a lot harder for DIY investors to run these kinds of deep analysis exercises to find the cheapest (or best value) online brokerage.

There are other variables, such as age of the investor, or what ticker symbols or the amounts of stock/securities being transacted, that can influence what kinds of costs a DIY investor pays for commissions or account fees.

One of the most interesting consequences of Surviscor’s latest analysis, however, is that the low pricing structures of online brokerages such as National Bank Direct Brokerage, Desjardins Online Brokerage, and HSBC InvestDirect are going to pique the curiosity of more and more investors.

Despite having a major focus on the Quebec market of DIY investors, based on the exposure this latest evaluation is getting online, National Bank Direct Brokerage will benefit from the attention. By implication, the bigger bank-owned online brokerages and traditionally viewed “low cost” providers will have to adjust course to compete even more aggressively with brokerages who are able to provide the convenience and confidence of a bank with a price point that, as yet, cannot be beaten by most online brokerages.

From the Forums

Price of Fame

Continuing on the theme of low cost online brokerages, reddit was abuzz discussing the findings of the latest Surviscor report. Check out posts here and here for users commenting on National Bank Direct Brokerage’s latest win and what DIY investors think about commission pricing at Canada’s online brokerages.

Flipping the Switch

Moving between RRSP providers can be nerve wracking. In this post, one redditor looks for community guidance in choosing between two very popular online brokerages.

Into the Close

That’s a wrap on another data-filled episode of the Roundup. Admittedly it was hard not to drop a doge reference into the whole article so what better way to channel “long” energy than by signing off on a meme-filled ending ahead of the long weekend! Be safe!

Posted on

Discount Brokerage Weekly Roundup – May 10, 2021

Spring is in the air. And coinciding with the appearance of new leaves, flowers, and Elon Musk on SNL is another seasonal feature: data on DIY investors.

In this edition of the Roundup, we continue to explore data on self-directed investors from the US and beyond that has sprouted up over the past few weeks, and how that data can help to inform where Canadian online brokerages need to prepare to head next. Also, forum chatter around the big Wealthsimple investment, as well as online brokerage service, find their way into the spotlight this week.

Self-directed Investor Snapshot: Two Different Studies Highlight Emerging DIY Investor Needs

Last week, we dug deep into a significant report on self-directed investors that the Ontario Securities Commission (OSC) released in April. This week, we explore two more online investor studies that crossed our radar recently – one from Refinitiv which looked at DIY investors across the world, and another from J.D. Power, which released findings from their US edition of the Investor Satisfaction Study.

Before diving into the key findings and takeaways from each of these different data sources, it is important to reflect on the details in the methodology of each of these resources. Often times, there are some fairly important claims that are made about online investors from research reports that can heavily influence what we think (and then do) about online investing.

Who These Reports Studied

The Refinitiv report, entitled “The Digital Wealth Agenda: Advancing the Self-Directed Investor Experience” explored the perspectives of just over 600 self-directed investors from 9 countries: Australia, Canada, China, Hong Kong, Japan, Singapore, Switzerland, the UK, and the US.

While there was no formal “methodology” section provided in the Refinitiv report (which was 12 pages long, including title and back covers), there were a few different figures and references that enabled a breakdown of the demographic data to be compiled.

Table 1: Regional Breakdown of Refinitiv Study Respondents

RegionCount% of Total
APAC26945%
Europe Region12621%
North America19833%

Table 2: Age Breakdown of Refinitiv Study Respondents

Age BracketCount% of Total
Millennials9816%
Gen X17629%
Over 5532754%

By comparison, the latest Investor Satisfaction Study from J.D. Power references data collected from surveying 4,895 investors in the US between December 2020 and February 2021, who “make all their investment decisions without the counsel of a full-service dedicated financial advisor.”

The Investor Satisfaction Study by J.D. Power is in its 19th year, and for this edition the definition of “Investor Satisfaction” was redesigned to be comprised of the following seven factors, listed here in order of importance:

  • trust
  • digital channels
  • ability to manage wealth (how and where I want it)
  • products and services
  • value for fees
  • people
  • problem resolution

From the study of investors, the Investor Satisfaction Study scores the satisfaction with online brokerages measured in the study on a 1,000 point scale. This year, data was shared on the following eight online brokerages:

  • Vanguard
  • Charles Schwab
  • T. Rowe Price
  • Robinhood
  • Fidelity
  • TD Ameritrade
  • E*TRADE
  • Merrill Edge

Caveats and Comments on Methodology

In comparing the two different data sets, it’s important to note that not only do they measure different populations of self-directed investors, but they’re also measuring them differently.

Refinitiv’s report describes statistics about certain facets of the online investing experience, whereas the J.D. Power Investor Satisfaction Study looks at “investor satisfaction” as defined by the components stated above. The definition of what constitutes satisfaction has evolved over time, and so too have the components that it is comprised of as part of the Investor Satisfaction Study.

Why these differences matter is because both reports are measuring self-directed investors, and the way in which those measurements are made matter when accurately stating the findings of these inquiries.

For readers of these reports, it is important to understand that self-directed investors are not a homogenous group. In the case of the Refinitiv report, for example, more than half (54%) of respondents were 55 or older, while only 16% were “Millennials.” This strong demographic skew heavily colours who the findings and insights apply to.

In contrast, detailed data from the J.D. Power Investor Satisfaction Study regarding demographics was not released in their public news release. This means without knowing details about the group of study participants, it is difficult to state which segment of investors the claims about satisfaction most apply to (e.g. younger or older investors).

Finally, it is also worth mentioning something about the commercial intent behind the release of the data.

In the OSC report, for example, a comprehensive set of data was released, in all likelihood because the institution is a public one with a mandate to help educate the public on matters relating to investors. There is clear public good to be served by sharing information about the composition of the Canadian retail investor base surveyed as part of their study.

On the other hand, the study by Refinitiv was part of a lead-capture program in which information about individuals was collected in exchange for access to the findings of the report. This is a common marketing tactic to better understand who is accessing data, and therefore determine whether this a possibility for a commercial relationship.

Similarly, the Investor Satisfaction Study is a proprietary report conducted annually by J.D. Power, and measures the “voice of customer” across multiple online brokerages. By publishing the limited amount of data on the analyzed firms and key findings of the study, the hope is that online brokerages or industry stakeholders will purchase the full report and data set.

Those points stated, it was nonetheless valuable to explore the key findings from each report and situate them against the online brokerage market here in Canada.

Interesting Data About Self-Directed Investors

A key theme of the data in the Refinitiv report centered around how self-directed investors seek out or want to use data as part of their online investing experience.

One of the most important findings from the report was that DIY investors still believe that price for commissions is an important factor. However, there are other components to the online trading experience that online brokerages the world over have to get right in order to retain or delight their clients.

The portrait of the online investor shown in the Refinitiv report is one in which there is little to no loyalty when it comes to staying with specific online brokerages.

In particular, an important finding of this report is that 47% of investors polled had a neutral Net Promoter Score (NPS) and 20% are “Detractors,” which implies that many investors view the relationship with their self-directed brokerage as transactional, and for a minority, as a negative. According to the survey, 33% of respondents would be considered Promoters – or individuals who would actively recommend their online brokerage (platform) to family, friends or associates.

Another interesting observation of the reported data is that different age groups have different needs and preferences when it comes to online investing information sources. In particular, younger investors appear to be more willing than older ones to seek out and use investment information on social media channels and forums.

Four key findings from the J.D. Power Investor Satisfaction Study were shared and included:

  1. Frequent glitches sap customer satisfaction
  2. Robinhood leads in new accounts but struggles to build trust
  3. Investor education remains the best resource, but brokerages not delivering
  4. Meeting clients’ holistic financial needs

There’s a lot to unpack in these four points, however, the first two points highlight that even in the face of record online account openings and customer growth in the US online brokerage space, brokerages have to prioritize stability and market accessibility in order to garner satisfaction (and potentially loyalty) from their clients.

The reality of the stock market is that it tends to work efficiently “most” of the time. However, at times of extreme volatility and emotion, that efficiency breaks down and opportunities for traders to capitalize on that efficiency gap present themselves.

For online investors brave enough to step into the volatility, especially in the US online trading space, it was evidently infuriating to encounter situations where trading platforms were down or trading was interrupted during the trading sessions when stock prices were moving around substantially. Similarly, when GameStop’s share price shot higher, the restrictions placed on trading those shares alienated significant pools of Robinhood’s audience and client base.

Arguably, one of the most interesting developments from the 2021 Investor Satisfaction Study is that the definition of “Investor Satisfaction” has now evolved to place trust at the top of the set of factors that determine whether an experience with an online broker is satisfactory.

What trust means, however, appears to be driven by accessibility and reliability of trading platforms.

The evolution of the investor satisfaction criteria, in particular the continued drop in prominence of price or value of fees, is fascinating in the context of the US online investing marketplace, where zero-commission trading has become the new normal.

For Canadian online brokerages, there is still a long way to go in terms of price drops before we reach full zero-commission trading, which means expectations for the online investor are likely high. As a result, the consequences of outages, trading interruptions, or anything that impairs accessing market opportunities quickly will be much worse for brokerages charging commissions per trade than those who do not.

People being charged what they believe to be high commissions per trade are going to be wary, if not resentful, of having to pay for trading online. The criteria from the J.D. Power Investor Satisfaction Study make it clear that when price is removed as a factor, service and the brand experience matter much more prominently.

It is on this latter point that both the Refinitiv study and the Investor Satisfaction Study by J.D. Power converge on a common issue: what is really special about an online brokerage?

When brokerages compete with one other on price, it becomes easier for consumers to set them apart on one of the most important metrics (price). But, when commission prices get to zero, it really does beg the question: What are you buying when you sign up for an online brokerage?

Features such as how easy or hard it is to get started, tracking transactions, access to reporting, data on portfolio/trade performance, and so much more than just the ability to place an order all make up important parts of the online investing experience (just ask any DIY investor at tax time).

In the case of the Refinitiv report, it’s also the data for trading ideas and opportunities that matters to investors. And, based on the J.D. Power study, it’s educating investors on the online trading experience.

Regardless of the study, it was fascinating that international investors and those closer to home share a view that most relationships with an online brokerage are “meh.” They are or appear to be transactional (thus their poor NPS ratings), and the online brokerage that has the best pricing or set of features wins.

With zero-commission trading, however, it is abundantly clear that features and client experience rise in prominence and highlight the need for online brokerages to focus on branding and defining what makes them special in the sea of sameness that is online investing.

Important Takeaways

COVID-19 has had a major impact on the online brokerage industry here in Canada as well as around the world. The data generated by several interesting research studies of the online investing space reveal that DIY investors are increasingly seeking out and demanding stronger digital experiences and features that provide either insights about investing or more efficient ways to manage and measure their own investment performance.

There are still a few more data reports set to be released about the Canadian online brokerage marketplace specifically over the next few months. However, this latest set of data about online investors provides great context for an industry in Canada that is seeing consumer sentiment and expectations be shaped by forces out of the US. It appears the same is true around the world, where the zero-commission trading option continues to spread.

When commission price does disappear, however, the lesson emerging from the different data points is for online brokerages to focus on the different components of the online investing experience with an eye towards improving the client journey to an online brokerage account, as well as what it feels like to be a customer.

And, despite some of the unknowns and limitations of the two data sets we examined, these reports provide valuable context and a pulse check on different demographics of DIY investors. This being the season of change, it seems entirely fitting that these reports are helping to understand what changes are starting to appear in the online investing landscape.

From the Forums

Out of Sight, Out of Kind

When it comes to resolving an issue with your online trading account, being seen or heard by your online brokerage is so important. In this post, however, one redditor has the unenviable moment where they have to get creative in order to be noticed by customer service.

Investment in Wealthsimple Attracts Attention

It wasn’t just the mainstream media coverage of the huge investment stake in Wealthsimple that was generating buzz. If ever there was an indicator of the popularity of Wealthsimple with younger, more digitally savvy investors, the buzz this news created on reddit is it.

Having reviewed thousands of online forum posts from DIY investors, seldom has a story generated so much engagement and interest as the news that Wealthsimple received a $750 million investment and valuation of $5 billion dollars. With over 900 upvotes and 400+ comments, there were a lot of opinions about what the investment means for Wealthsimple and in particular, Wealthsimple Trade. And these engagement numbers were on just one of the several posts about this topic that were generated this past week.

Suffice it to say that it wasn’t only online investors chatting about this development, there’s a good chance that many, if not all, online brokerages in Canada were also trying to digest how this massive infusion of capital into Wealthsimple is going to play out. We’ll cover more on this in an upcoming Roundup but for now, the sentiment in this post is telling.

Into the Close

It’s 2021 and things are a different kind of interesting. It’s fair to say that Elon Musk’s act on SNL is harder to follow than his explanation of what Dogecoin is. And yet, by announcing that Dogecoin is simultaneously a hustle and a method of payment for a mission to the moon, well, it seems like only Musk can top (or topple) Musk. For now though, here’s hoping that there’s more positive news on the vaccination front to look forward to this upcoming week. Have a profitable week ahead!

Posted on

Discount Brokerage Weekly Roundup – May 3, 2021

It’s hard to fathom, but May is already/finally here. For the superstitious market participants, it’s the month that investors tend to seek an exit (sell in May and go away). The data, however, paints a different picture to trying to time an exit – and interestingly enough, we’ve got data in spades this month.

In this edition of the Weekly Roundup, we launch into a new month with a quick update on the latest deals and promotions activity, and then take an ultra-deep dive into a huge report on DIY investing published by one of Canada’s most influential securities regulators. Given the length of this week’s Roundup, we’ll save reporting on the forum chatter for next week.

Discount Brokerage Deals Update for May

It’s the start of a new month, and that means our regularly scheduled check-in on the online brokerage deals landscape for Canadian DIY investors.

This month, online brokerage deals and promotions are effectively on cruise control, with no major offers launching or ending to begin the new month. That said, there are some interesting observations about the current status of deals and promotions, as well as some other interesting developments that point to activity “off Broadway” when it comes to how certain online brokers are approaching the deals and promotions space.

One of the first important observations for this spring is the paucity of cash-back offers. BMO InvestorLine is the only Canadian online brokerage offering a mass-market cash-back bonus promotion. In a world where the race between bank-owned online brokerages is as close as it is, BMO’s offer will undoubtedly boost their exposure for DIY investors looking for a big-bank option.

Instead of cash-back offers this spring, it appears that most other online brokers coming to market with a promotion are opting for commission-free trade bonuses. After the RSP contribution deadline, HSBC InvestDirect launched their commission free trade offer. Prior to that, National Bank Direct Brokerage also launched a sizeable commission-free trade promotion. Other online brokerages, such as Questrade, have maintained their commission credit promotions throughout the year with no signs that they are concluding.

The takeaway here seems to be that Canadian online brokerages are looking to control their costs by offering up commission-free trades, which while valuable to consumers, also cost less than cash-back promotions.

Interestingly, for one online brokerage that already offers commission-free trading, Wealthsimple Trade, cash back is the go-to option. We’ve noted that over the past few months there have been cash-back bonuses ranging from $50 to $100 for new clients of Wealthsimple Trade. These bonuses have been available through different affiliates that work with Wealthsimple Trade.

From a big picture perspective, data on the interest in retail investors signing up to open new accounts (a key target for online brokerages) shows that this traffic is slowing down.

While some stories, like cryptocurrencies, continue to generate interest and participation in trading online, stock markets are nowhere nearly as “cheap” or as volatile as they were a year ago. As a result, without the added catalyst of a contribution deadline looming, or significant market volatility, it appears that the speed and intensity of account openings will decrease.

What that means for deals and promotions throughout the rest of the spring and into summer, however, is that online brokerages who want to gain more attention and possibly market share have an opportunity to do so now before both the cost and complexity of doing so goes up in the fall – when the ramp up to next year’s RSP contribution season begins.

It is especially curious that given the important changes taking place in the industry – such as the recent rebrand of Qtrade, potential new entrants to the Canadian online brokerage space, and the rise in prominence of commission-free trading provider Wealthsimple Trade, that online brokerages are not more assertively coming to market with promotional offers.

Deals and discounts provide an opportunity to win the attention of DIY investors looking for a good fit for online brokerage services, and promotions – including commission-free trade promotions – enable DIY investors a low-risk route to try out the experience with an online brokerage.  It’s a low-cost, win-win option, especially when the alternative for most Canadian online brokerages is to win the race to provide outstanding digital experiences faster than a commission-free brokerage can provide features investors want.

DIY Investor Deep Dive: Recent Study Provides Insights on Online Investors

Last month, the Ontario Securities Commission (OSC), which is the securities regulator in Ontario, released an in-depth study of retail investors in Canada in response to the rise in interest of online investing during the past year.

Clocking in at 59 pages (46 if you don’t count title slides), this report was a treasure trove of data that explored many facets of the online investing experience, and was organized into the following categories:

  • The impact of the COVID-19 pandemic
  • Products and performance
  • Reasons for being self-directed
  • Risk preferences
  • Markets and order types
  • Information used to determine investments and trading decisions
  • Time spent investing
  • Tools, features, and apps

With so much data to dig into, there’s a lot to digest about the online investor space in Canada, especially as it relates to attributes about DIY investors. That said, there are a few key areas of interest that warrant mentioning in the Roundup, given the impact to the online brokerage space in Canada.

Methodology

Before diving into some of the more noteworthy findings of the report, it is useful and appropriate to highlight the methodology and background of the study to appreciate just how valuable the data is that was collected and released.

The OSC self-directed investor report studied 2,000 Canadian investors using an online poll administered by research firm Leger, between November 17 and December 6, 2020. To qualify for the survey, individuals had to identify as a self-directed investor for one of their accounts, and they were required to have at least one of a series of investment products, such as individual stocks, ETFs or REITs, bonds, mutual funds, or other types of securities or derivatives.

While the report disclosed standard demographics like gender, age, and geography, it also reported interesting parameters such as the value of DIY investments (which 85% of respondents disclosed). With a concentration of focus in Ontario (43%), and skewing male (60%) there is clearly an overrepresentation in the data towards the behaviour and perspectives of a sub-group of Canadian DIY investors.

Another important note to keep in mind is that this report stated that it would have a margin of error of +/- 2%, 19 times out of 20, based on its sample of 2,000 respondents. Why that is particularly relevant will become clear in diving into some of the data that was reported, and how the data from this study stacks up against reports of the online investing space over the past year from other sources.

The “Rise” of DIY Investing

The first major finding of this survey is perhaps its most controversial: that “10% of investors opened their self-directed account during the pandemic.”

Looking closely at the data underlying that claim, 10% of respondents claimed to have had their direct investing account for less than nine months. Compared against the number of respondents (9%) that claimed to have had their accounts for between 9 months and one year, the number of survey respondents that actually opened an account during the pandemic seems shockingly low.

A report by the Investment Industry Regulatory Organization of Canada (IIROC) in February of this year cited a statistic from financial research firm Investor Economics that showed there were more than 2.3 million online brokerage accounts opened in 2020 (from January to December) compared to 846,000 in the same period in 2019.

The 170% increase in account opens reported by Investor Economics implies that the sample taken by the OSC study does not materially reflect the actual percentage of investors who opened an online brokerage account for the first time between March and December. As a result, the first claim should probably be restated as:
“10% of the investors who participated in this survey opened their self-directed account during the pandemic”

Interestingly, this more accurate phrasing was part of the OSC report’s press release in one place, but not in others, and as such could be misleading to readers trying to understand what online brokerages, investors, and other research studies have indicated as a historic year in online investing.

That important caveat about who this data actually represents in mind, this report did provide an extensive view into an important collection of online investor attributes, behaviours, and perceptions that is worth reading through.

DIY Investors Enjoy It

One of the more fascinating findings of this survey was that of the underlying motivation to being a DIY investor.

When queried as to why they do not use an advisor to manage their investments, it was surprising to see that 44% of respondents stated that they enjoyed managing their investments. The next most popular answer was that 34% found that having an advisor manage their investments was too expensive.

The responses provided shed light on a narrative that doesn’t get nearly enough attention in the world of online investing – that individual DIY investors enjoy managing their own investments. It is important to note, however, that alongside the average (44%) there were additional attributes that helped to make a more nuanced assessment of the response data.

For example, there was clearly a significant preference for respondents whose household investments were greater than $500K, compared to respondents with lower amounts of investments. Specifically, 64% of respondents whose investments exceeded $500K stated they enjoy managing their own investments, compared to 39% for those that had less than $100K, and 45% for those who had between $100K and $500K.

Another interesting contextual piece is that there was a significant relationship between individuals who reported enjoying managing their own investments and their self-perceived knowledge of investing. 56% of individuals who reported having a high perceived knowledge of investing reported that they enjoyed managing their own investments, compared to only 22% of respondents who had low self-perceived knowledge.

The key takeaways here are that the more money you have and the more you believe in your understanding of investments, the more it seems you like to be a DIY investor.

With so much focus on commission price when it comes to selecting an online brokerage, it was equally fascinating to see the data pattern emerge from respondents when it came to perceptions of value for management of investments. Stating that something is “too expensive” could be in reference to many things, but what was fascinating to note was that regardless of the perceived knowledge or the amount of household investment, between 33% and 40% of respondents agreed that the price of advice was too high. Though it was not deemed statistically significant, it was nonetheless intriguing to see that more household investments a respondent had, the more likely they were to see advice as too expensive.

Although it might not have scored as the primary motivating factor in this sample of DIY investors, the level of agreement between investors of different knowledge levels and asset levels that advisors are “too expensive” reflects one of the strongest value propositions for online brokerages: perceived value matters.

Again, coming back to the fact that 80% of the respondents of this survey have had their DIY investing accounts for more than a year, the fact that just about one third of DIY investors in the survey had price as a key driver implies that there is a very big segment of online investors who are prepared to do the work required to manage their own finances, including some of them who don’t believe they can get a better return themselves.

Perceived Knowledge: The Double-Edged Sword

At its core, all investing is speculative. When investors claim to have a high degree of perceived knowledge about investing, the term “knowledge” could mean different things to different people. Of course, feeling like you know, as it turns out, could have a huge impact on whether or not you enjoy DIY investing.

Another interesting data point to emerge from this survey is that 69% of respondents reported feeling satisfied with their experience overall as an investor (20% report being very satisfied and 49% reported being somewhat satisfied). Any reader of social media comments about online brokerages over the past year would probably have a different view of this data. This serves to illustrate that what conclusions you can draw about the industry or the endeavour of investing online depends heavily on who you ask, and where those investors are sourced.

The contextual information alongside the percent satisfaction illustrates an interesting pattern that shows the greater the size of investments ($500K or over) and the higher the perceived knowledge, the more likely an investor will be satisfied with their experience as a DIY investor. This was the same data pattern observed in asking why DIY investors did not want to go with a financial advisor. The number that really jumps out is the difference in satisfaction between individuals with high perceived knowledge (84% of them claimed to be satisfied), versus those with low perceived knowledge (37%). Clearly, if online brokerages can address the perceived knowledge gap, there’s reason to believe that satisfaction will improve.

Of course, a little bit of knowledge can be a dangerous thing, and another fascinating data point to emerge was when respondents were challenged to answer five skill-testing questions about marketplaces and orders. 

Shockingly, none of the 2,000 investors polled answered all five of the questions right, and only 4% got four of five questions right.

Perhaps even more shocking (and a touch ironic), even the survey authors made a mistake on the name of a major stock exchange in Canada, the Canadian Securities Exchange (CSE). It begs the question: if regulators and survey creators can get this stuff wrong, what hope do DIY investors have?

It is fascinating to see that 13% of individuals who self-identified as having high perceived knowledge of investing thought that Wealthsimple Trade, which was used as a decoy option, was a real stock exchange. The lack of investor awareness of the different securities exchanges in Canada, as well as where stocks can be traded, highlights a gap in understanding of some of the basic information that would be material to an investor, like where to go to find more information about a security they invested in, or what happens to an order if the exchange experiences an outage.

The fact that respondents could score so poorly on questions about the mechanics of trading online, while at the same time rate their satisfaction with being an online investor so highly, implies that much of the process of online investing itself is disconnected from really having to understand some basic (but important) information about the assets being traded. Ironically (again) this was brought up just this past week by investing sage Warren Buffet who implied that online brokerages, in particular those like Robinhood with a focus on younger investors (and who saw a massive surge in new accounts during the pandemic), are catering towards the gambling instincts of investors.

Key Takeaways

There’s a lot in the latest OSC report on DIY investors in Canada that didn’t get covered or explored in this week’s Roundup. What was clear, however, is that there is a lot of valuable information that was published about a certain segment of DIY investors that were polled by the survey conducted.

One important (perhaps clear) takeaway is that it is important to carefully qualify the limitations of the data of any study or survey when it comes to making broad statements about the full population of DIY investors in Canada. The insights provided by this report appear to heavily describe investors who have been at investing for at least a year and are largely centered in Ontario. Ultimately, anyone hoping to get more insight into the Canadian DIY investor space learned some very interesting things from this report.

Perhaps the biggest point of interest is that the experience of online investing is one that is not only driven by price, which tends to dominate the narrative. Instead, there are clearly very human features – like enjoying the process – that comprise a significant part of why people choose to invest online as a DIY investor.

Where both industry and regulatory associations might be able to improve the experience is clearly in investor education. Not only in terms of understanding more about investing, but also when it comes to the important and often overlooked details of marketplaces and operational issues (including things like taxes) that DIY investors either don’t pay attention to, or aren’t being provided sufficient resources on.

Finally, it would be great to see reporting like this done at a regular cadence so that changes over time could be tracked and understood. There are numerous stakeholders that could benefit from this data, and it’s great that the OSC was able to publish this data set, but tracking these trends requires ongoing data capture. Just like watching a portfolio requires taking a long-term approach, there are now more DIY investors than ever, and tracking what shapes their experience over time is going to be perennially important to understand.

Into the Close

That’s a wrap on this data-intensive version of the Roundup. The good news for online brokerage industry nerds/enthusiasts is that there are a few more data reports that we didn’t get a chance to dive into this week, so be on the lookout next week for even more data insights. Now that May is upon us, it feels entirely appropriate to end with a strong meme! Stay safe!

Posted on

Discount Brokerage Deals & Promotions – May 2021

As hard as it is to believe, May is already upon us. With the tax filing deadline now officially behind us and RSP season now a distant memory, online brokerage deals and promotions activity is likely set to gear down.

At the start of a new month, there isn’t a lot to report from the larger players in the space, however there are signs of promotional activity uptick we noted last month at non-big-five bank-owned online brokers.

The good news for anyone hoping to open an online investing account at this point (and there’s data pointing to strong interest on the part of online investors continuing to open accounts), is that there’s a healthy selection of offers to choose from.

That said, it seems most Canadian online brokerages with an active promotion are in favour of commission-free trade offers for the time being.

Certain online brokerages do offer cash-back bonuses through affiliate offers, however, so be sure to check our online investing deals & promotions section for more information about these.

Expired Deals

No expired deals to report on at this time.

Extended Deals

No new deal extensions to report at this time.

New Deals

No new promotions to report on at this time.