Posted on Leave a comment

Stocks 2011 Conference

What: Stocks 2011

When: Oct. 20-31st

Where: Hyatt Regency Vancouver

How Much: Free  (VIP section will require payment)

Stocks 2011 is an investment conference featuring some great speakers providing their insight into the stock market – from specific sectors and stocks to macroeconomic trends that affect the market. Although much smaller than the World Money Show, this event is a chance to get some thought provoking perspectives on the current markets.  In addition to presenters there will be companies showcasing products and services related to stocks as well as companies providing information on possible investment opportunities. To find out more information or to register online go to: http://www.stocks2011.ca/

Posted on Leave a comment

tradescores.com

Site: www.tradescores.com

Technical Analysis Tools: Yes

Fundamental Analysis Tools: Yes

Markets Covered: US, Canada

Notes: Tradescores is a great market analysis and training tool for beginners and intermediate traders. One of the greatest features of this site is the trading simulation tool which allows you to practice what it would be like to execute trades with a “practice” account. Unlike many other great simulators out there, what really makes this one stand out and worth using is the focus on risk management. Most simulators unfortunately only provide you with your percentage gained or loss in dollar terms – a real weakness in my opinion, because controlling risk is crucial to success in the stock market. Tradescores, on the other hand, forces you to use risk management techniques every time you place an order. By tracking your trades and showing you how much risk you are taking, this tool really helps traders zero in on developing this critical skill. The charting and interface are also fairly user friendly and so it earns high marks for a great set of features and user-friendliness. As an added bonus, there’s a community challenge that you can participate in to show off your trading skills with!

Posted on Leave a comment

StockCharts.com

Site: www.stockcharts.com

Technical Analysis Tools: Yes

Fundamental Analysis Tools: Yes

Markets Covered: US, Canada

Notes: A great site for technical analysis information, stockcharts.com has a comprehensive section called “ChartSchool” where you get as much technical info as you can handle. There are several great articles in this area that explain fundamental and technical analyses, as well as incredible sections on different chart types. The greatest feature about this site (and there are several) though has to be the extensive section on technical indicators and overlays. If you hear about different types of indicators like a MACD (moving average convergence divergence) or a moving average and you want to know what they mean, you’ll want to check out this section of their site.


Posted on Leave a comment

freestockcharts.com

Site: www.freestockcharts.com

Technical Analysis Tools: Yes

Fundamental Analysis Tools: Yes

Markets Covered: US, Canada

Notes: This is by far one of the most versatile free resources available to individuals looking for market information. The biggest strengths of Freestockcharts.com are that it provides near real-time data (basically as trades are happening), it has an incredibly easy to use charting program, a comprehensive set of technical indicators and best of all, it’s FREE!! There are paid options to use added functionality however there is still quite a bit that you can access for free. If you are looking to get started anywhere on a charting platform or are looking for trading data without a large delay, this is one you should seriously consider.

Posted on Leave a comment

Finviz.com

Finviz.com

Site: www.Finviz.com

Technical Analysis Tools: Yes

Fundamental Analysis Tools: Yes

Markets Covered: US

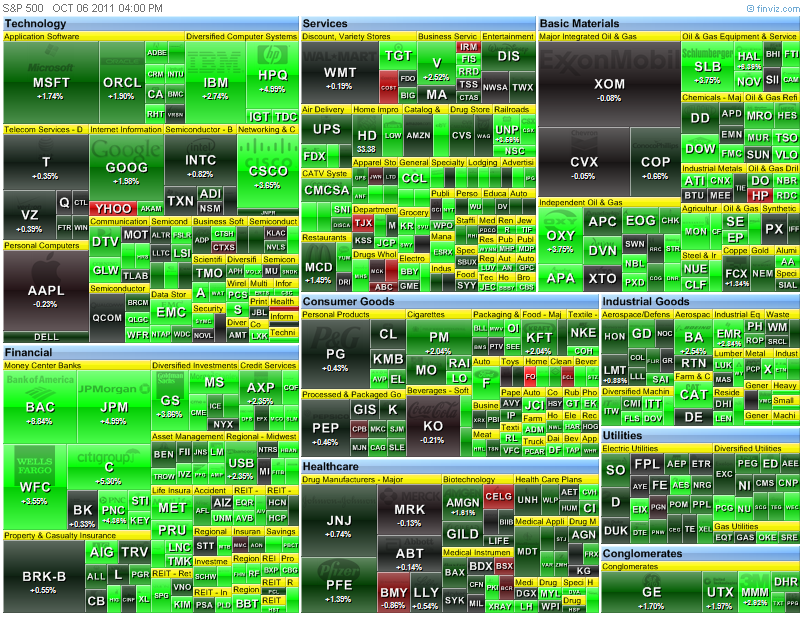
Notes: This is a fantastic site that provides market information throughout the day as well as some incredibly powerful yet easy to use filters to scan through the US stock markets. It is far and away one of my most favourite tools to use and best of all, many of the features are free. One of the best (and it’s hard to choose just one) things about this site is the visual element to the tools they provide. For example they have a “heat map” that visually shows you how each of the stocks in a particular market is trading. As you can see below (a picture of the heat map of the S&P 500), the stocks that have done well for the day are in green and those that have lost money are red (wouldn’t it be great if everyday was this green!!!) and those that haven’t really done anything are in black.

Heat Map of S&P 500
Heat Map of S&P 500 – wouldn’t it be nice if every day was this green?!