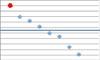
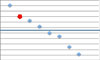
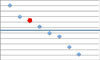
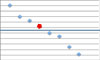
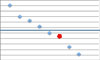
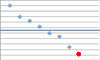
Table 2: Average J.D. Power and Associates Investor Satisfaction Results (2009-2012)
| Sparxline | Company | Average Score |
|---|---|---|
 |
741 | |
 |
720 | |
 |
713 | |
 |
702 | |
 |
690 | |
 |
684 | |
 |
665 | |
 |
652 |
Sources:
- J.D. Power and Associates 2012 Discount Brokerage Investor Satisfaction Study
- J.D. Power and Associates 2011 Discount Brokerage Investor Satisfaction Study
- J.D. Power and Associates 2010 Discount Brokerage Investor Satisfaction Study
- J.D. Power and Associates 2009 Discount Brokerage Investor Satisfaction Study
Note:
Companies listed in this table have at least 3 years of results to use in calculating an average. Companies excluded because of insufficient data were Qtrade, HSBC InvestDirect and Credential Direct.
Pages: 1 2